Training:
The next tab is our Training tab. You will have the same download and date range functionality as the Risk tab. 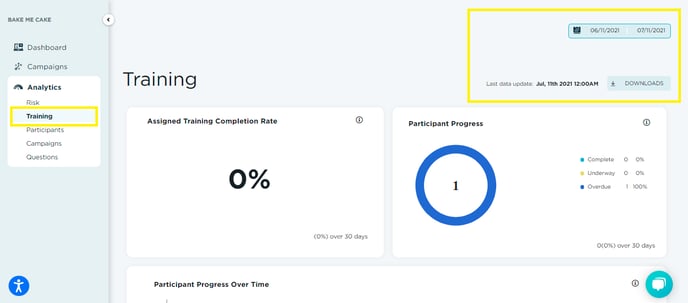
In assigned Training Completion rate, you will see the percentage of training that is being completed by your users. The day count in the bottom right corner of the card is calculated based on the date range chosen.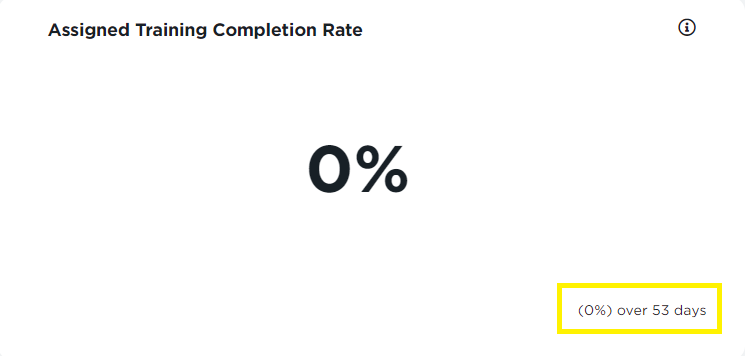
In Participant Progress, you will see a breakdown of 3 statuses for your users. This will abide by the date range functionality as well.
Complete: Number of users who have completed all assigned training
Underway: Number of users who have not completed all assigned training
Overdue: Number of users who are behind on mandatory training
The number in the Donut chart is the total participants by status, excluding blocked or removed users.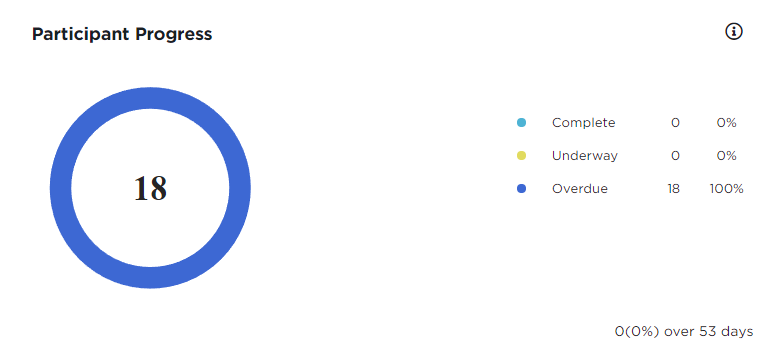
The last section of the Training Analytics is Participant Progress Over Time. This section will be color coded the same as the Participant Progress section and is designed to show a timeline of content completed. 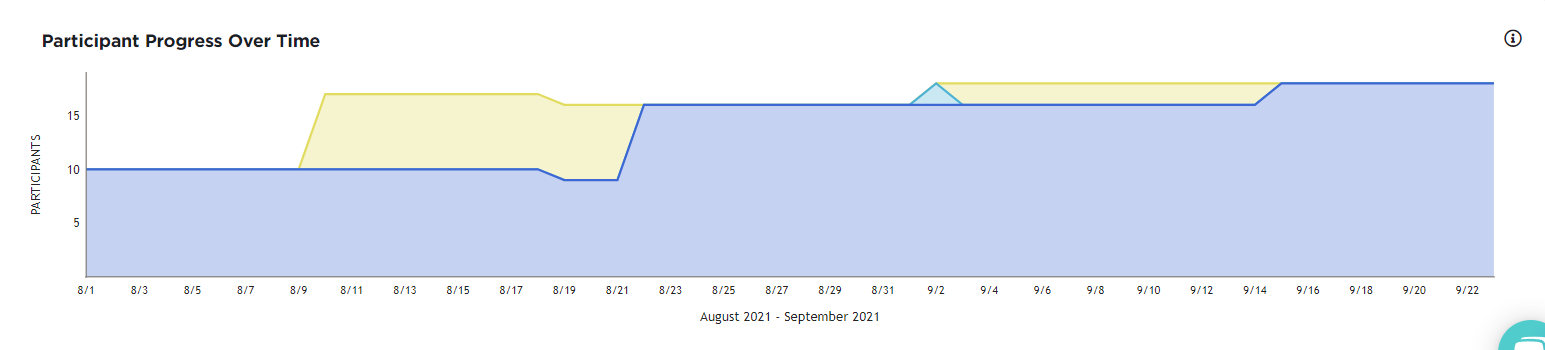
If you are unsure about what a specific category is measuring, or would like more details, click on the (i) for a breakdown.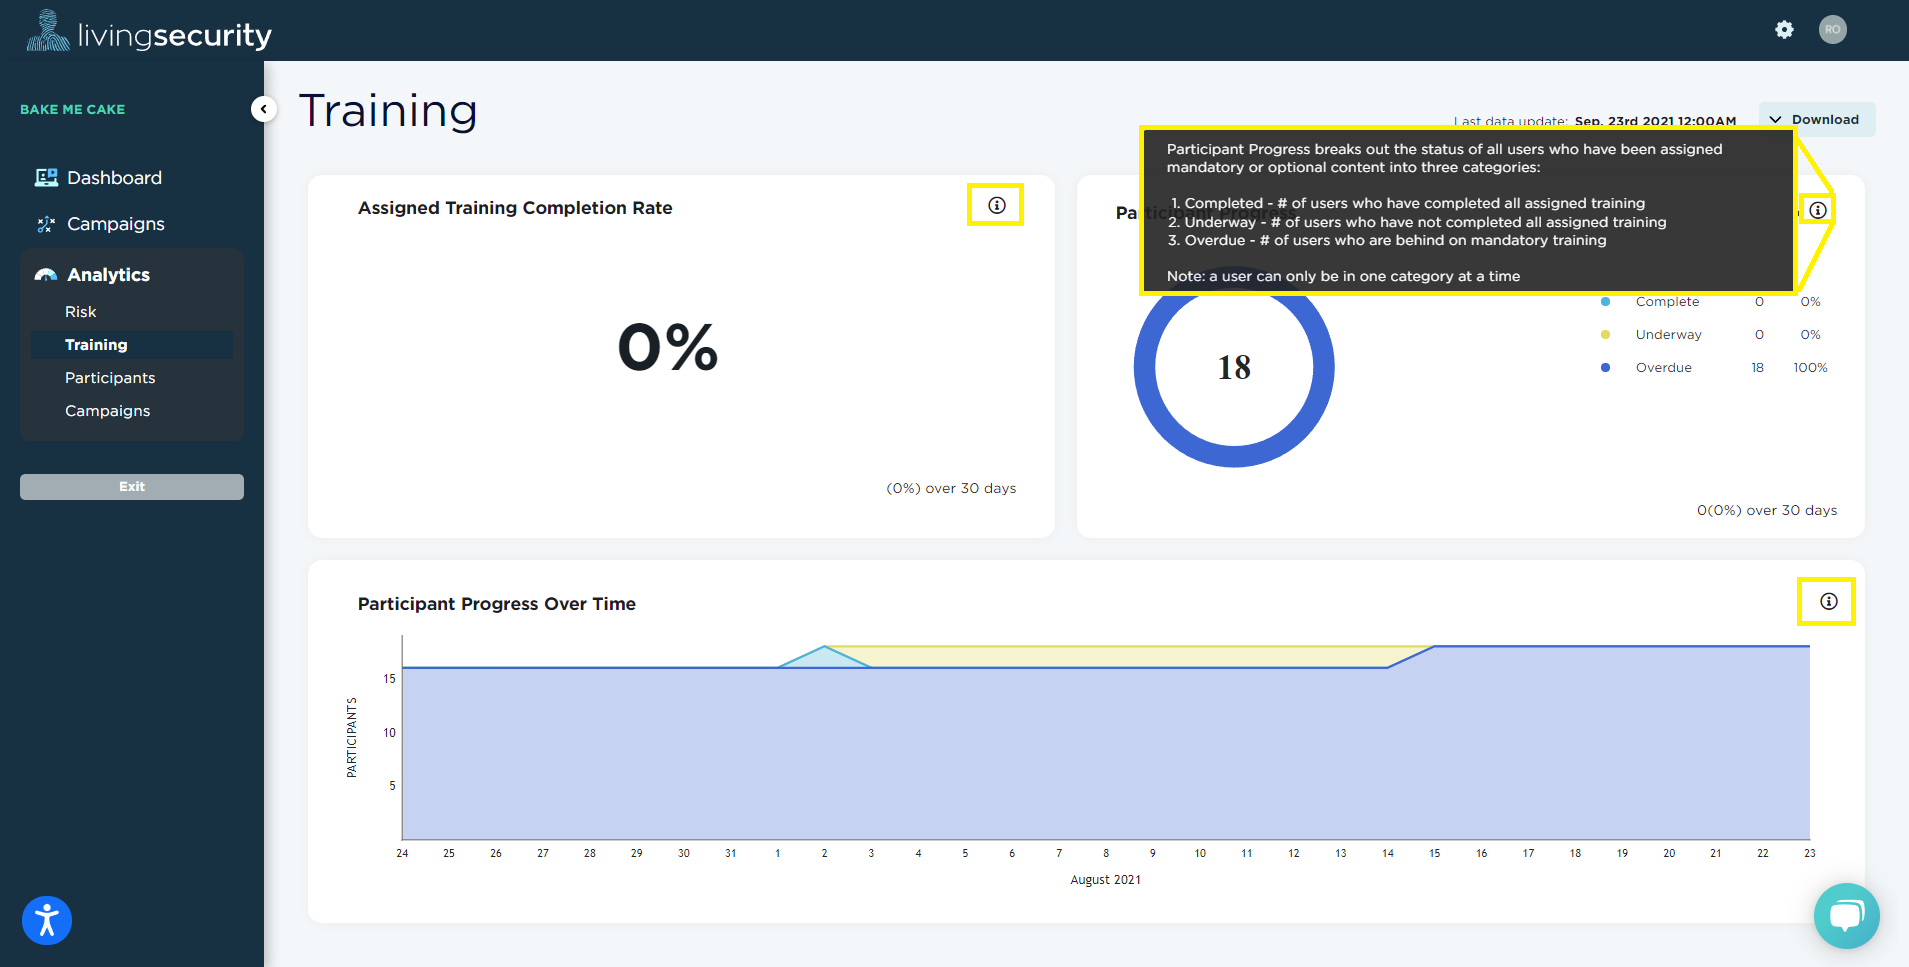
If you have any additional questions, please feel free to contact us! We're happy to help.
Learn more about Living Security Training Analytics:
Training Platform - Export and Analyze Your Reports Video Course
Training Platform - Analytics: Participant Tab Video Course
