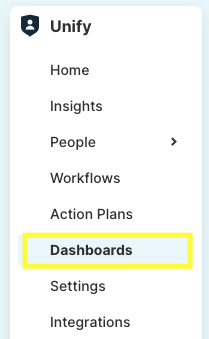
Unify - Dashboards
Dashboards is a powerful feature designed to enhance reporting on Behavior Score, Insights, and Human Risk Index trends. With Dashboards, you can create and save custom reporting views, track key metrics for specific user groups, and gain valuable insights into your organization's human risk and behavior trends.

Report Templates
Users can choose from two templates to build their dashboards:
- HRI Tracking Report
- Behavior Score Tracking Report
Each report provides an organization-wide view for the previous 30 days by default. Users can customize:
- Timeframe: Choose a fixed or flexible timeframe.
- Group Segments: Group users by specific segment types (e.g., by department or location).
- Insights to Track: View the top 12 insights based on impact or select up to 5 specific insights to monitor trends over the selected timeframe.
Chart Layout
- Risky Insights: Red bars represent the riskiest insights within the selected timeframe.
- Vigilant Insights: Green bars highlight the most vigilant insights.
- Summary Statistics: Key metrics like the percentage of the cohort detected for certain behaviors (e.g., "80% of 'X lens' was detected for Simulated Phish Clicked").
Filtering Options
Unify Dashboards dynamically update as you:
- Adjust the timeframe
- Apply lenses to filter by identity groups
- Select specific insights to track
Use Cases
Trend Analysis: Monitor key metrics over time for different user groups.
Executive Reporting: Present focused, data-driven insights to leadership.